

 Whether you are a Developer, Product Manager, or CEO, it’s important that you identify, measure, and improve the right metrics. If you do, you’ll have clear understanding of when you’re adding value to customers and when you’re not.
In the ideal scenario, as your metrics go up and to the right, your customer satisfaction moves in the same direction. When that’s the case, you’ll also benefit by knowing what direction to take your product and to build a roadmap that’s aligned with improving your customer experience.
Defining the right metrics isn’t rocket science, yet many teams get it wrong. While there are no hard and fast rules, here are some easy-to-follow guidelines for how you can go about choosing metrics that matter.
Guidelines for choosing metrics that matter
Easy to understand
A good metric should be easy to understand, access, and lead to action. When you share metrics amongst your team (and ideally your entire organization), they should be able to comprehend what each metric signifies and how it aligns with your vision/objectives.
Easy to access
Quality metrics are also easy to access. This means they are not overly complicated to calculate and are available in tools used across your company, like Google Analytics, Amplitude, Looker, Slack, and others.
Lead to insights
Great metrics lead to insights (which in turn lead to action and results). Analyzing them informs decisions like reducing onboarding hurdles, building features that lead to value-added usage, or personalizing user experiences to grow engagement.
Avoid totals
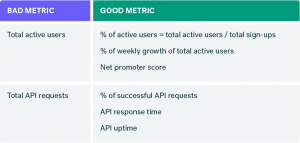
We often see teams make the mistake of tracking feel-good metrics like Total Active Users or Total API Requests. Measuring totals gives you only the half picture. To get the full picture, you need to measure things like conversions (%), growth (Δ change), customer engagement, and customer satisfaction. Totals = vanity metrics.
Note: There is one exception where a total makes sense — your revenue.
Here are a few examples of bad metrics vs. their better counterparts
 Great outcomes require great inputs
Results are outcomes of inputs. And great outcomes require great inputs combined with a bit of patience. Even for the most widely-used products, there’s always a delay (lag time) to knowing if an outcome is moving in an intended direction. During this time of uncertainty, it’s important to know you’re heading in the right direction.
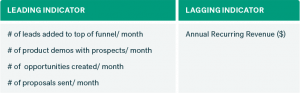
In such cases, you’ll need to identify and define the differences between two types of metrics: leading indicators and lagging indicators.
- Leading indicators are like inputs. They measure the activities necessary to achieve your goals.
- Lagging indicators are like outputs. They measure the actual results.
Let’s take an example of a B2B SaaS company, Banjo Analytics, who wants to measure and improve Annual Recurring Revenue (ARR). Since it takes several months for Banjo to close a new deal, they define a handful of leading indicators around their Sales pipeline to ensure that they’re on track to achieve their lagging key metric — ARR.
 Choosing the right metrics also depends on many factors like type of product or offering, business model (B2C/B2B), industry (e-commerce/SaaS/marketplace), job function (Product/Marketing/Sales/Recruiting), and many more.
To give you a starting point for what metrics to use for your business, we’ve synthesized a handful of popular frameworks below.
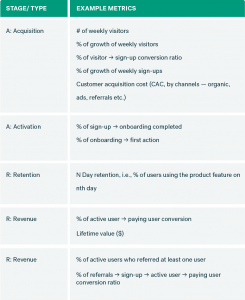
Pirate metrics
Commonly used for: User-generated content or engagement apps like Instagram, Headspace, and Strava.
AARRR (Pirate Metrics) is a metrics framework developed by Dave McClure and is widely used by business to consumer software companies. This framework outlines fives stages of a user’s journey, starting from acquisition and progression to a successful referral, which ultimately leads to a virtuous loop for growth.
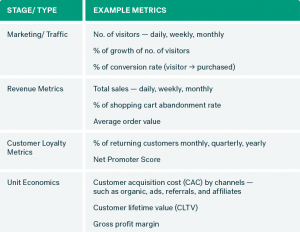
 E-commerce metrics
Commonly used for: E-commerce websites and apps including but not limited to Bonobos, Crate & Barrel, and Levi’s.
If you’re selling products online, you’ll want to track metrics about how customers are finding your app, how they’re engaging with it, how and when they’re making purchases, and whether or not they’re coming back for more.
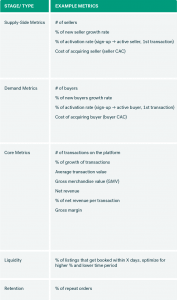
 Two-sided marketplaces
Commonly used for: Companies that have two-sided marketplaces, like DoorDash, Instacart, Uber, and Opendoor.
Marketplaces are incredibly powerful and create new consumer habits by re-imaging the way buyer ↔ seller transactions traditionally happen. Building and running a two-sided marketplace is quite the juggle, as you have to keep both buyers (demand) and sellers (supply) continually motivated.
 At surface level, a two-sided marketplace may seem like twice the work. But when proven successful, two-sided marketplaces can have much more than twice the payoff.
Some of the useful metrics to measure when you are running a two-sided marketplace are:
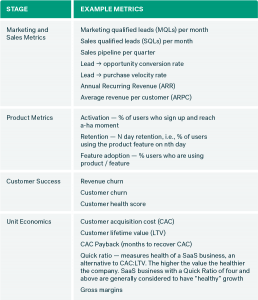
 SaaS metrics
Commonly used for: B2B Software/SaaS companies, like New Relic, Zendesk, and Segment.
B2B Software or SaaS (Software-as-a-Service) is software that is built for business use cases rather than consumer. SaaS products are often purchased through a subscription model and typically have a long selling cycle (up to years in some cases). Since the time to purchase SaaS can be very long, it’s imperative to measure leading indicators to know you’re moving in the right direction before it’s too late.
Common metrics at SaaS-led companies include:
 Analyzing metrics
While identifying and defining your key metrics is a great starting point, it’s also helpful to use frameworks to add more context to insights. Think of a framework as a guideline that will help you breakdown your data into digestible parts, rendering it more actionable.
For example, let’s say you’re tracking time to pay back the cost of customer acquisition (CAC Payback) as a key metric. Just knowing your CAC Payback metric in and of itself is probably not all that insightful. You’ll also want to look at more detailed metrics, like which types of customers yield a faster CAC Payback, or how a paid acquisition campaign compares to customers coming from organic or referral traffic sources.
Example frameworks
Ideal customer profile
Not all customers are created equal. They come in many shapes and sizes, and can become loyal customers at vastly different rates. That’s why it’s helpful to look into the traits and qualities that make up your ideal customer profile.
For simplicity’s sake, let’s define a segment as a group of customers that share a common characteristic. You could segment customers by range of information like demographics, industry, pricing plan, or behavior, and compare the metrics of one segment to another.
For example, if you are running an e-commerce startup, you could segment customers by region to analyze how people in large cities make purchases compared to suburban areas. If you’re in SaaS, you might want to look into churn numbers by company size (small companies vs. mid-market vs. enterprise) to define a segment to focus on.
Cohort analysis
Another powerful tool to analyze your metrics is cohort analysis. Instead of looking at all users as one unit, cohort analysis breaks users into related groups and compares similar groups over time.
For example, let’s say you’re building a SaaS product and a key metric you care about is retention. After surveying a handful of churned customers, you find many were unaware of core features at the time of sign up. So you decide to run an experiment.
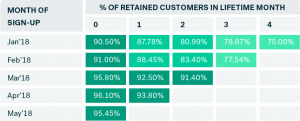
You change your onboarding flow to increase feature awareness, which would hypothetically increase retention. You quickly get to work and launch the new onboarding flow in February of 2018. When you run a cohort analysis based on month of sign up, you can track how your key metric (% of retained customers) is improving for uses who went through the new onboarding flow.
In the example below, you can see that cohorts of customers who signed up after Feb’18 are sticking with your product at higher rates compared to those who signed up in the past. Hooray!
 Aligning your team towards a single metric
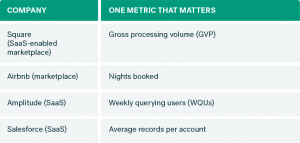
Metrics are a great way to set direction and alignment inside your team (and entire company for that matter). As we know from earlier, it’s easy to lose focus and fall victim to “shiny object syndrome” — that is to say, an affinity toward the latest technologies and trends. This is where the concept of “One Metric that Matters” (OMTM) can be a useful tool.
OMTM is a powerful concept that can align your entire company around a single metric. Your OMTM measures the positive impact as a whole, and all other metrics tracked will essentially cascade from this one metric.
To help illustrate this, here are a handful of OMTM examples of few well-known companies:
 Understanding why metrics matter and what model to start with is an important step. After that, you’ll need to get more specific and define the right customer data to track that’s particular to your use case. And with that, let’s head over to next chapter.
Read more: Event Metrics That Will Impress Your Executive Team

